Example 9: Temporal average#
This example demonstrates how to calculate temporal mean and plot with GINCCO_lib
using GINCCO_lib.temporal_mean.monthly_mean().
Code Example#
Now we will import the library and the grid
# =========================
# IMPORTS
# =========================
import numpy as np
from netCDF4 import Dataset
from datetime import *
import GINCCO_lib as gc

# =========================
# CONFIGURATION
# =========================
tstart = datetime(2010, 1, 1)
tend   = datetime(2011, 12, 31)

path = '/work/users/tungnd/GOT271/GOT_REF5/OFFLINE/'

# =========================
# LOAD GRID AND DEPTH
# =========================
fgrid   = Dataset(path + 'grid.nc', 'r')
lat_t   = fgrid.variables['latitude_t'][:]
lon_t   = fgrid.variables['longitude_t'][:]
depth_t   = fgrid.variables['depth_t'][0,:,:]
dxy_t   = fgrid.variables['dxdy_t'][:]
mask_t_var = fgrid.variables['mask_t']
if mask_t_var.ndim == 3:
    mask_t = mask_t_var[0, :, :]
elif mask_t_var.ndim == 2:
    mask_t = mask_t_var[:, :]
depth_t[mask_t==0] = np.nan
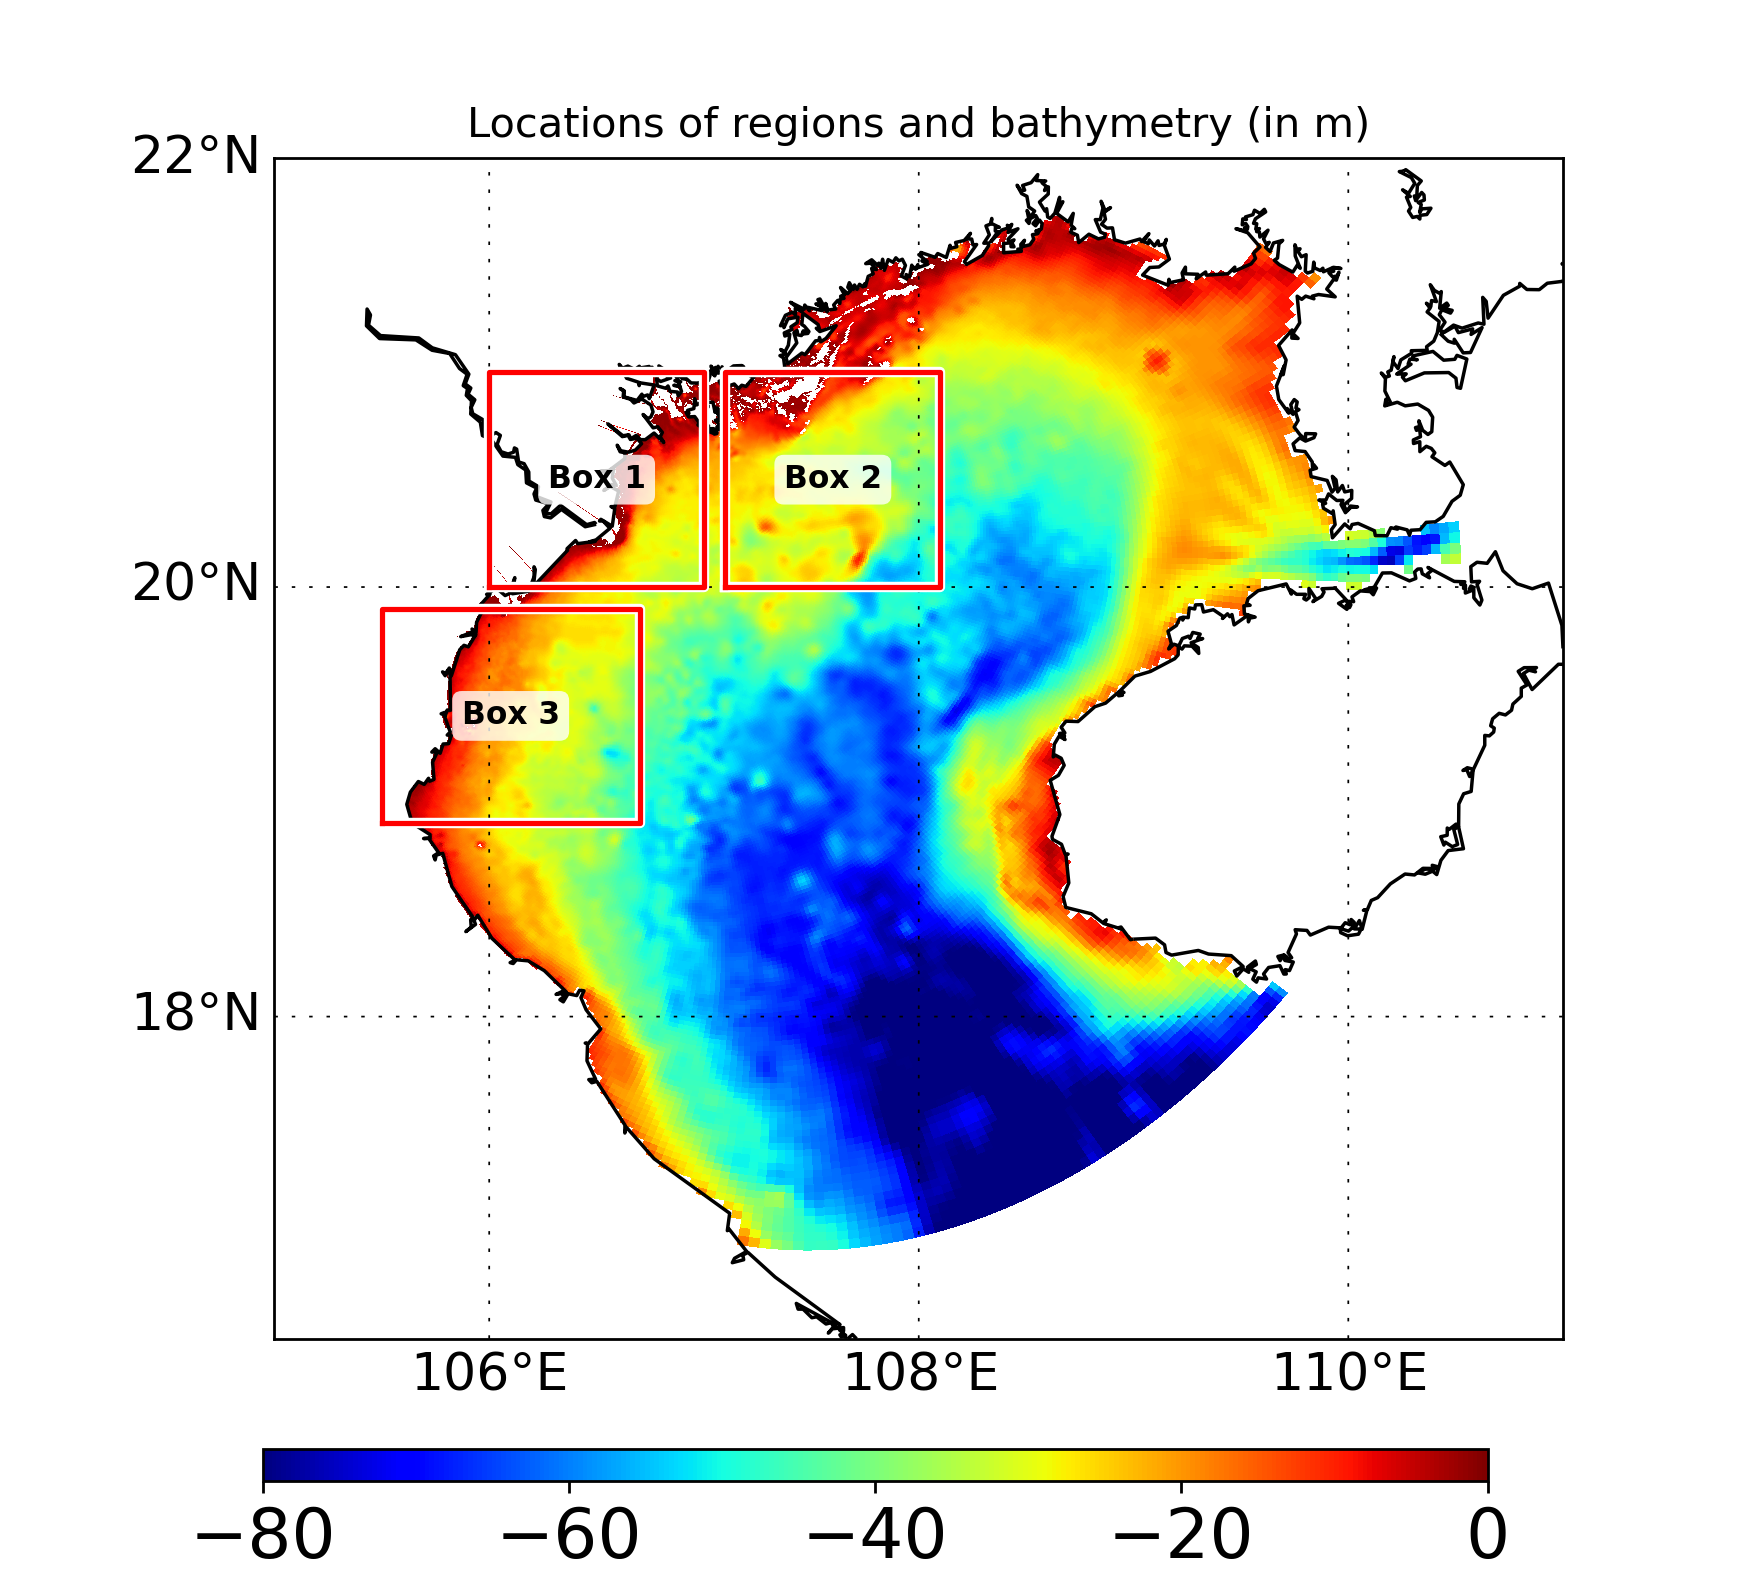
Now define the box to average. In this example, we will define 3 boxes
# Step 1: Define a box
lon_min_box = [106, 107.1, 105.5]
lon_max_box = [107, 108.1, 106.7]
lat_min_box = [20, 20, 18.9]
lat_max_box = [21, 21, 19.9]
label_list = ['Box 1', 'Box 2', 'Box 3']

# Step 2: Plot boxes
gc.map_draw_box(
    lon_min=105, lon_max=111,
    lat_min=16.5, lat_max=22,
    title="Locations of regions and bathymetry (in m)",
    lon_data=lon_t,
    lat_data=lat_t,
    data_draw=depth_t[:, :],
    lon_min_box = lon_min_box,
    lon_max_box = lon_max_box,
    lat_min_box = lat_min_box,
    lat_max_box = lat_max_box,
    label = label_list,
    path_save="/prod/projects/data/tungnd/figure/",
    name_save="map_box"
)
Now import data, calculate the mean and plot it
# Step 3: Import salinity map
# data_draw shape = (number of points, number of days)
sal_surface = gc.import_surface(path, 'sal', tstart, tend, ignore_missing='False')
# Step 4: Calculate salinity mean
sal_mean = np.zeros((len(lon_min_box), (tend-tstart).days +1 ))
for i in range(0, len(lat_min_box)):
sal_mean[i,:] = gc.spatial_average(sal_surface,
dxy_t,
mask_ocean=mask_t,
lon_t=lon_t,
lat_t=lat_t,
lon_min=lon_min_box[i],
lon_max=lon_max_box[i],
lat_min=lat_min_box[i],
lat_max=lat_max_box[i],
)
# Step 5: Monthly mean
sal_mean_monthly, label = gc.monthly_mean(data = sal_mean, tstart = tstart,tend = tend, time_axis = 1)
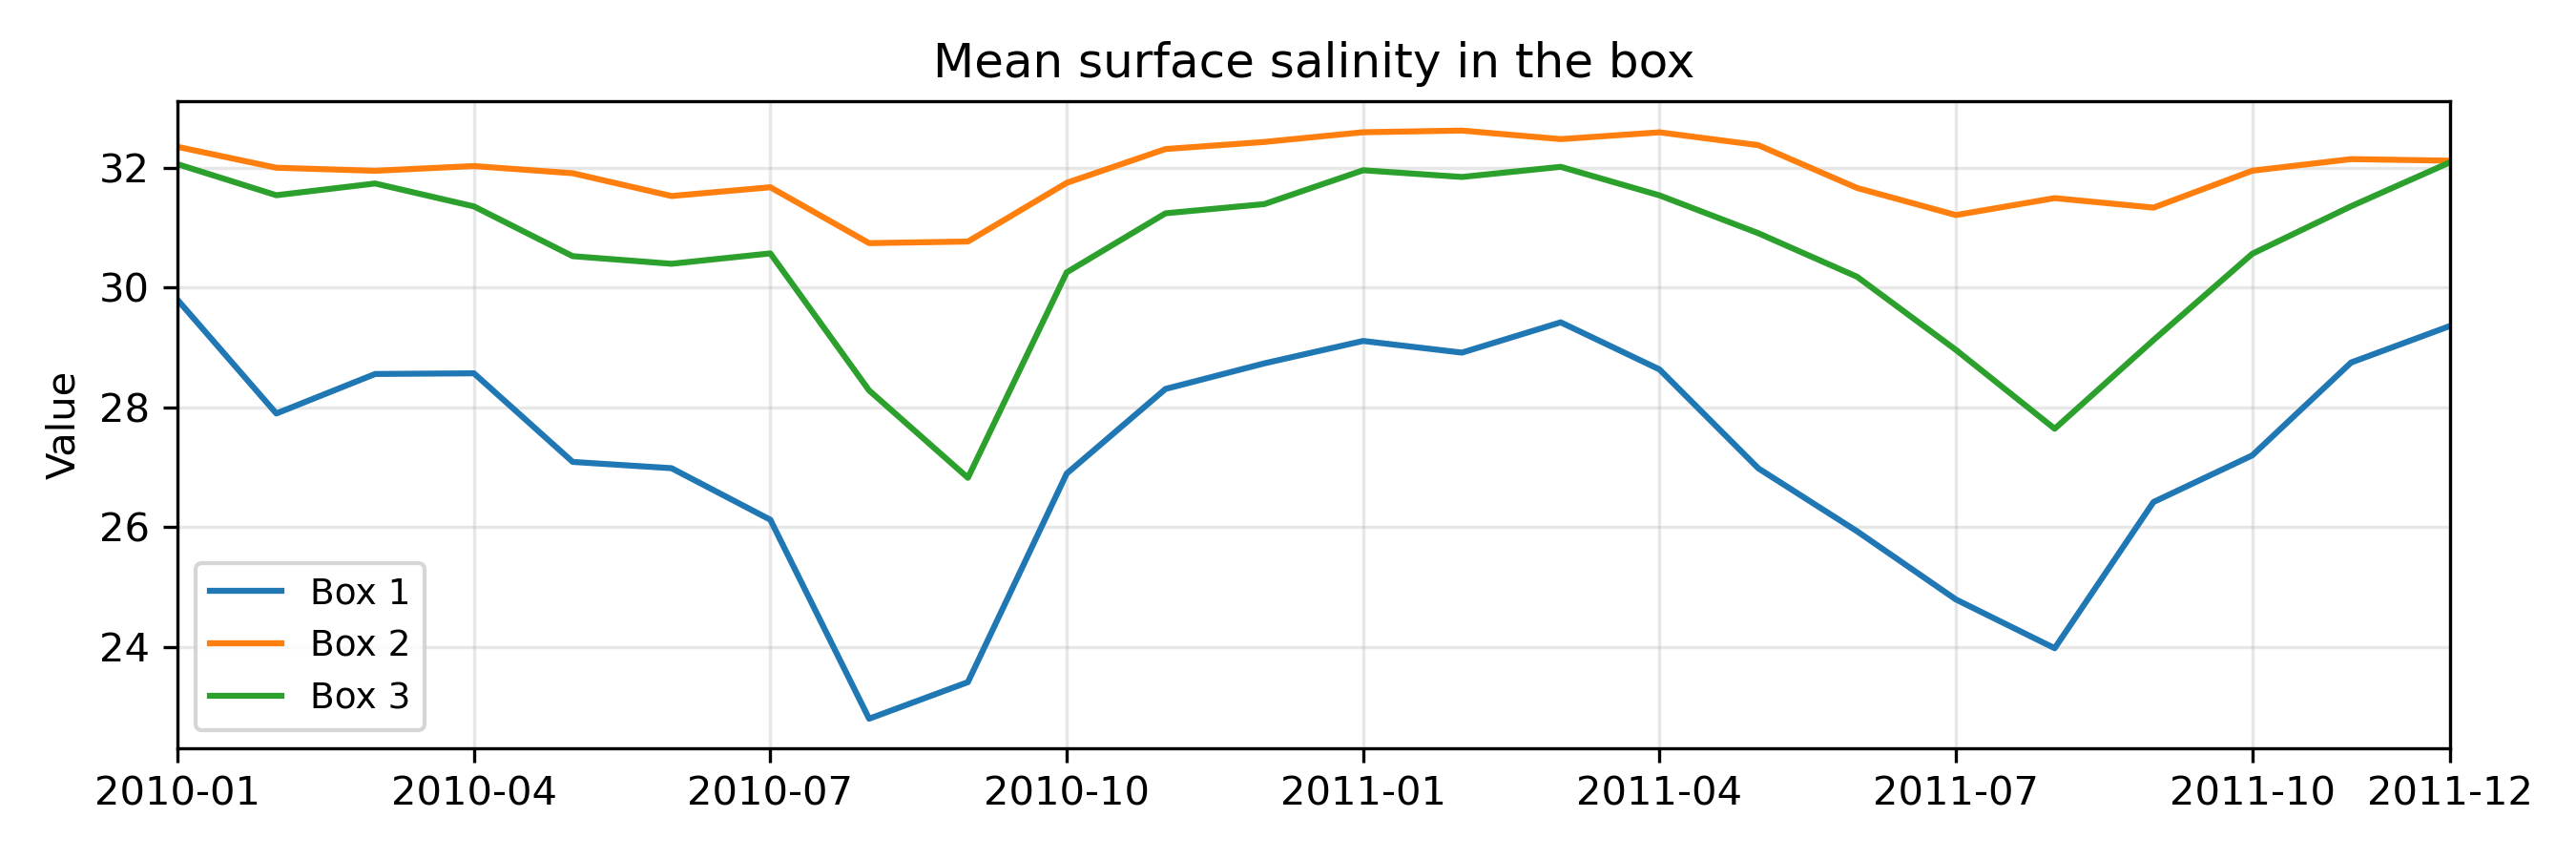
# Step 6: plot
gc.plot_point_monthly(
title="Monthly mean surface salinity in the box",
time_label = label, # sequence of str or anything convertible to str, len = n_time
data_point = sal_mean_monthly, # numpy array, shape (n_point, n_time) or (n_time,)
n_xticks_desired=8, # user suggestion; function will adjust for nice spacing
path_save="/prod/projects/data/tungnd/figure/",
name_save="figure9",
point_labels=label_list # optional list of names for each point
)