Example 10: Custom coastline#
This example demonstrates how to plot a map wwith custom coastal line with GINCCO_lib
using GINCCO_lib.map_plot.map_draw().
Code Example#
Now we will import the library and the grid
# =========================
# IMPORTS
# =========================
import numpy as np
import GINCCO_lib as gc
from netCDF4 import Dataset
from datetime import *

# =========================
# CONFIGURATION
# =========================
tstart = datetime(2010, 1, 1)
tend   = datetime(2010, 1, 10)

path = '/work/users/tungnd/GOT271/GOT_REF5/OFFLINE/'

# =========================
# LOAD GRID
# =========================
fgrid = Dataset(path + 'grid.nc', 'r')
lat_t = fgrid.variables['latitude_t'][:]
lon_t = fgrid.variables['longitude_t'][:]
Now define the box to average. In this example, we will define 3 boxes
# ============================================================
# EXAMPLE 10: plot with a custom coast line
# ============================================================


# OpenStreetMap shapefile is in a projected coordinate system (meters) instead of geographic (lat/lon)
# and Basemap requires longitude–latitude (EPSG:4326) coordinates.
# So we need to convert it
# Note: it may be super slow to run this command (10 or more minutes). Please be patient when the code is running.

import geopandas as gpd

# Read the Web Mercator shapefile
gdf = gpd.read_file("/data/projects/LOTUS/tungnd/openstreetmap-coastline/lines.shp")

# Convert to geographic coordinates (lon/lat)
gdf = gdf.to_crs(epsg=4326)

# Save as a new shapefile
gdf.to_file("/data/projects/LOTUS/tungnd/openstreetmap-coastline/osm_coastline_wgs84.shp")

# Simplified version for faster loading
shp_simplified = gdf.simplify(tolerance=0.05)
gdf.geometry = shp_simplified
gdf.to_file("/data/projects/LOTUS/tungnd/openstreetmap-coastline/osm_coastline_wgs84_simple.shp")
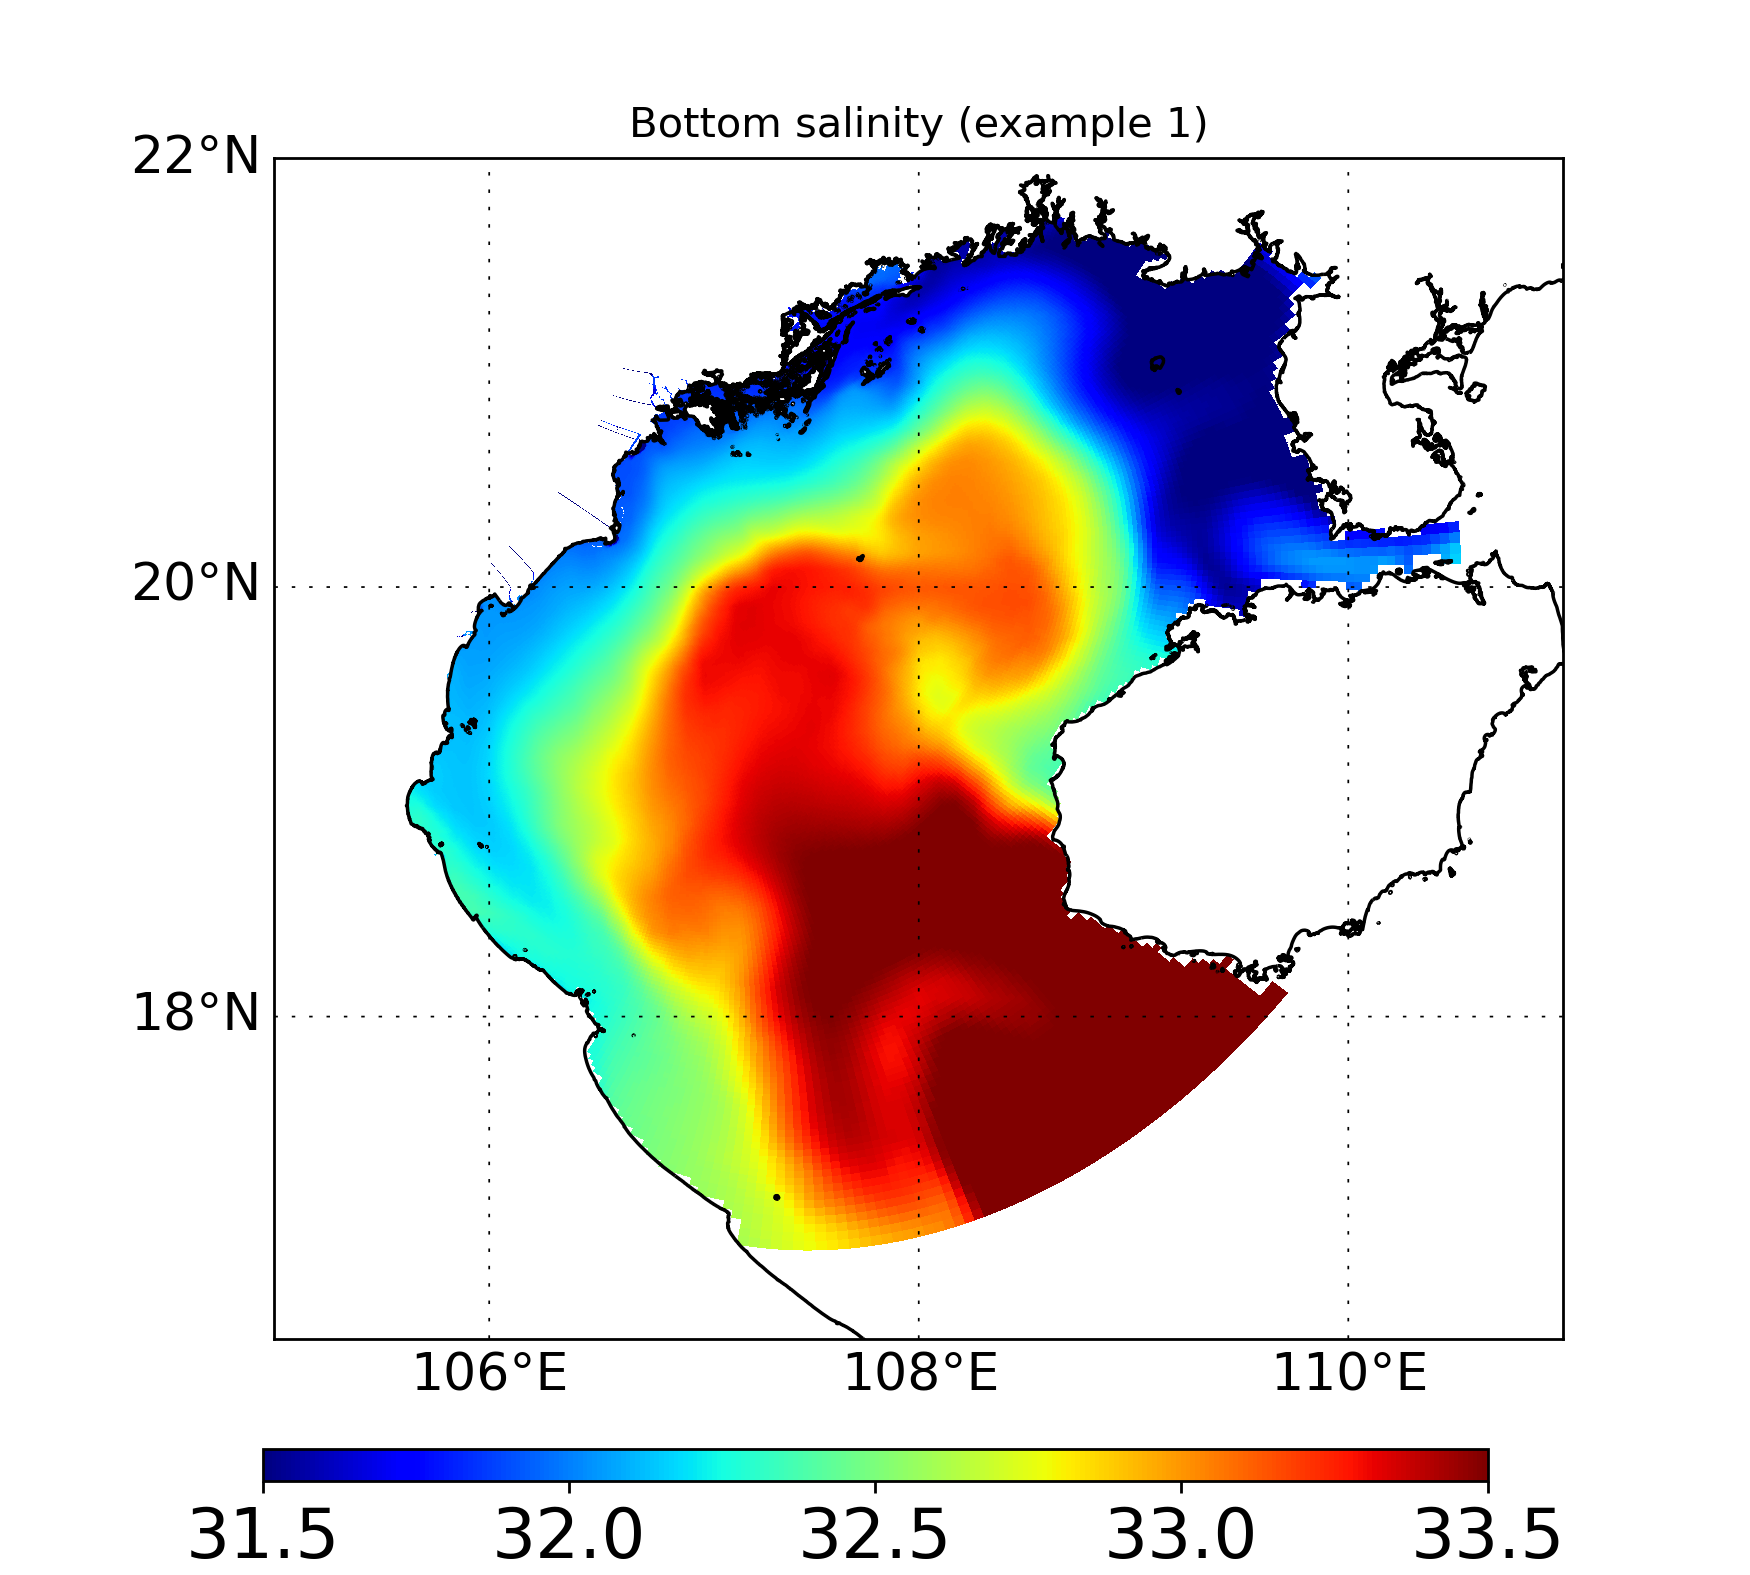
Now import data, and draw, with full resolution coastal line
sal_full = gc.import_4D(path, 'sal', tstart, tend, ignore_missing='False')

# Plot using the full coastal line
gc.map_draw(
    lon_min=105, lon_max=111,
    lat_min=16.5, lat_max=22,
    title="Bottom salinity (example 1)",
    lon_data=lon_t,
    lat_data=lat_t,
    data_draw=sal_full[0, 0, :, :],  # day 0, level 0
    path_save="/prod/projects/data/tungnd/figure/",
    name_save="example10.1",
    custom_coastline = "/data/projects/LOTUS/tungnd/openstreetmap-coastline/osm_coastline_wgs84",
    layer_name= "osm_coastline_wgs84",
)
Plot using the simplified coastal line
gc.map_draw(
    lon_min=105, lon_max=111,
    lat_min=16.5, lat_max=22,
    title="Bottom salinity (example 1)",
    lon_data=lon_t,
    lat_data=lat_t,
    data_draw=sal_full[0, 0, :, :],  # day 0, level 0
    path_save="/prod/projects/data/tungnd/figure/",
    name_save="example10.2",
    custom_coastline = "/data/projects/LOTUS/tungnd/openstreetmap-coastline/osm_coastline_wgs84_simple",
    layer_name= "osm_coastline_wgs84_simple",
)
