Example 3: Section Plot#
This example demonstrates how to import file and draw a section plot of one or several points with GINCCO_lib
using GINCCO_lib.heatmap_plot.plot_heatmap().
Code Example#
Now we will import the library and the grid
# =========================
# IMPORTS
# =========================
import numpy as np
from netCDF4 import Dataset
from datetime import *
import GINCCO_lib as gc

# =========================
# CONFIGURATION
# =========================
tstart = datetime(2010, 1, 1)
tend   = datetime(2010, 10, 30)

path = '/work/users/tungnd/GOT271/GOT_REF5/OFFLINE/'

# =========================
# LOAD GRID AND DEPTH
# =========================
fgrid   = Dataset(path + 'grid.nc', 'r')
lat_t   = fgrid.variables['latitude_t'][:]
lon_t   = fgrid.variables['longitude_t'][:]
mask_t_var = fgrid.variables['mask_t']
if mask_t_var.ndim == 3:
    mask_t = mask_t_var[0, :, :]
elif mask_t_var.ndim == 2:
    mask_t = mask_t_var[:, :]

depth_t = fgrid.variables['depth_t'][:, :, :]

# Apply mask: set land values to NaN
mask_t_3d = np.repeat(mask_t[np.newaxis, :, :], depth_t.shape[0], axis=0)
depth_t[mask_t_3d == 0] = np.nan
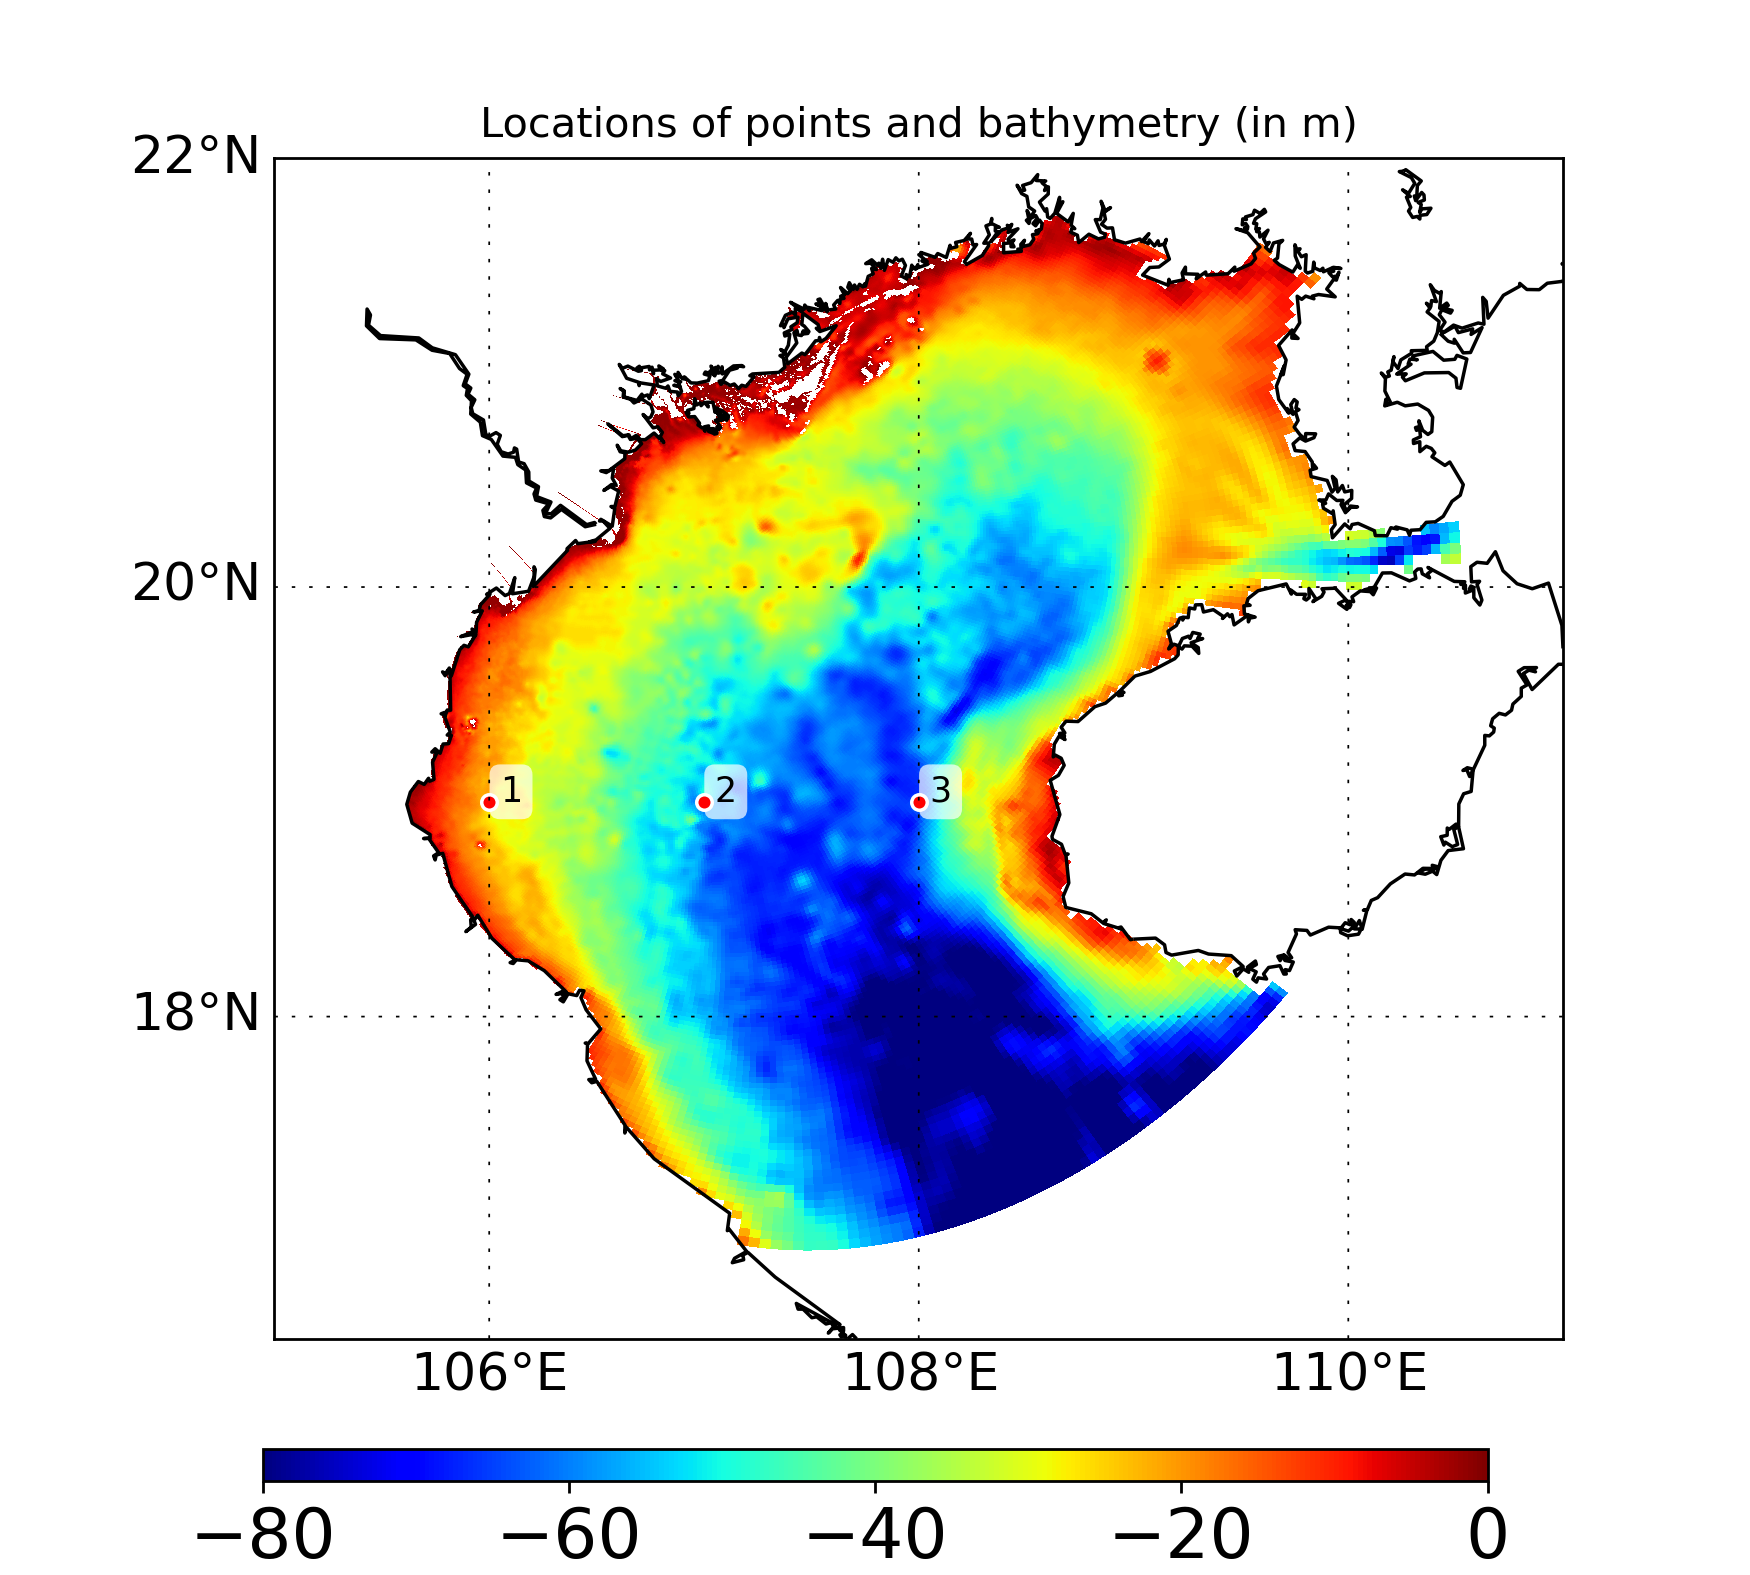
Now define the point and see where it is on map
# ============================================================
# EXAMPLE: Plot salinity profiles at 3 points
# ============================================================

# Step 1: Define three points along latitude 19N
lon_p = [106, 107, 108]
lat_p = [19, 19, 19]

# Step 2: Plot locations of the points with bathymetry
gc.map_draw_point(
    lon_min=105, lon_max=111,
    lat_min=16.5, lat_max=22,
    title="Locations of points and bathymetry (in m)",
    lon_data=lon_t,
    lat_data=lat_t,
    data_draw=depth_t[0, :, :],
    lat_point=lat_p,
    lon_point=lon_p,
    path_save="/prod/projects/data/tungnd/figure/",
    name_save="example3.1"
)
Now import data and plot the results
# Step 3: Import salinity profiles for the defined points
# data_draw shape = (number of points, number of days, number of depths)
data_draw = np.zeros((len(lon_p), (tend - tstart).days + 1, np.size(depth_t, 0)))
point_index = np.zeros((len(lon_p), 2), dtype=int)
for i in range(len(lon_p)):
data_draw[i, :], point_index[i, :] = gc.import_profile(
path, 'sal', tstart, tend, lat_p[i], lon_p[i],
ji='False', ignore_missing='False'
)
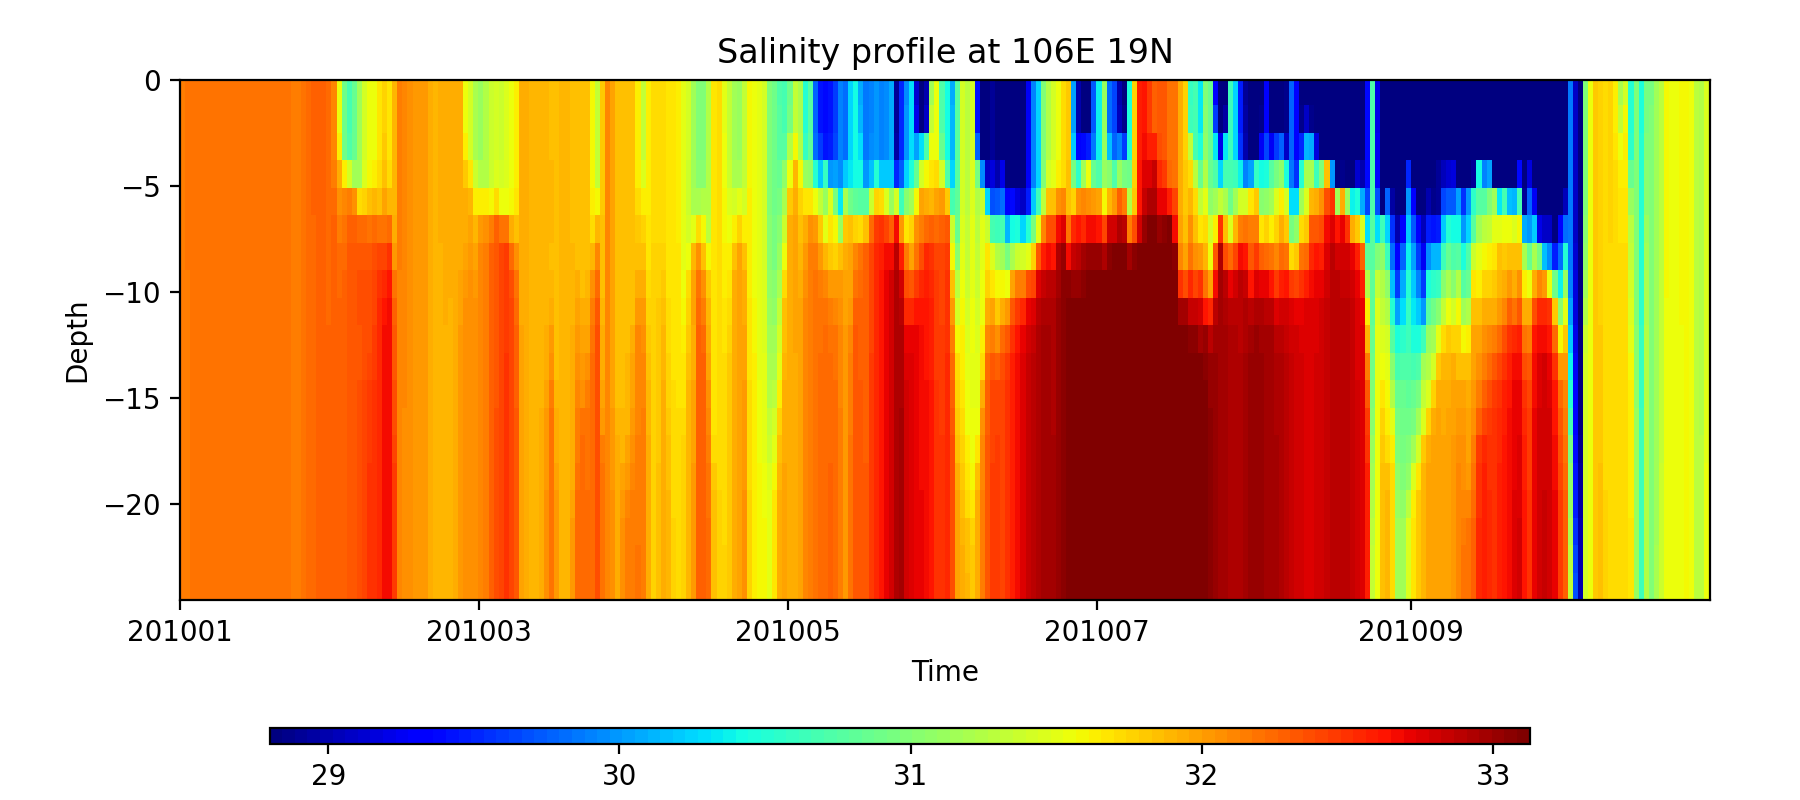
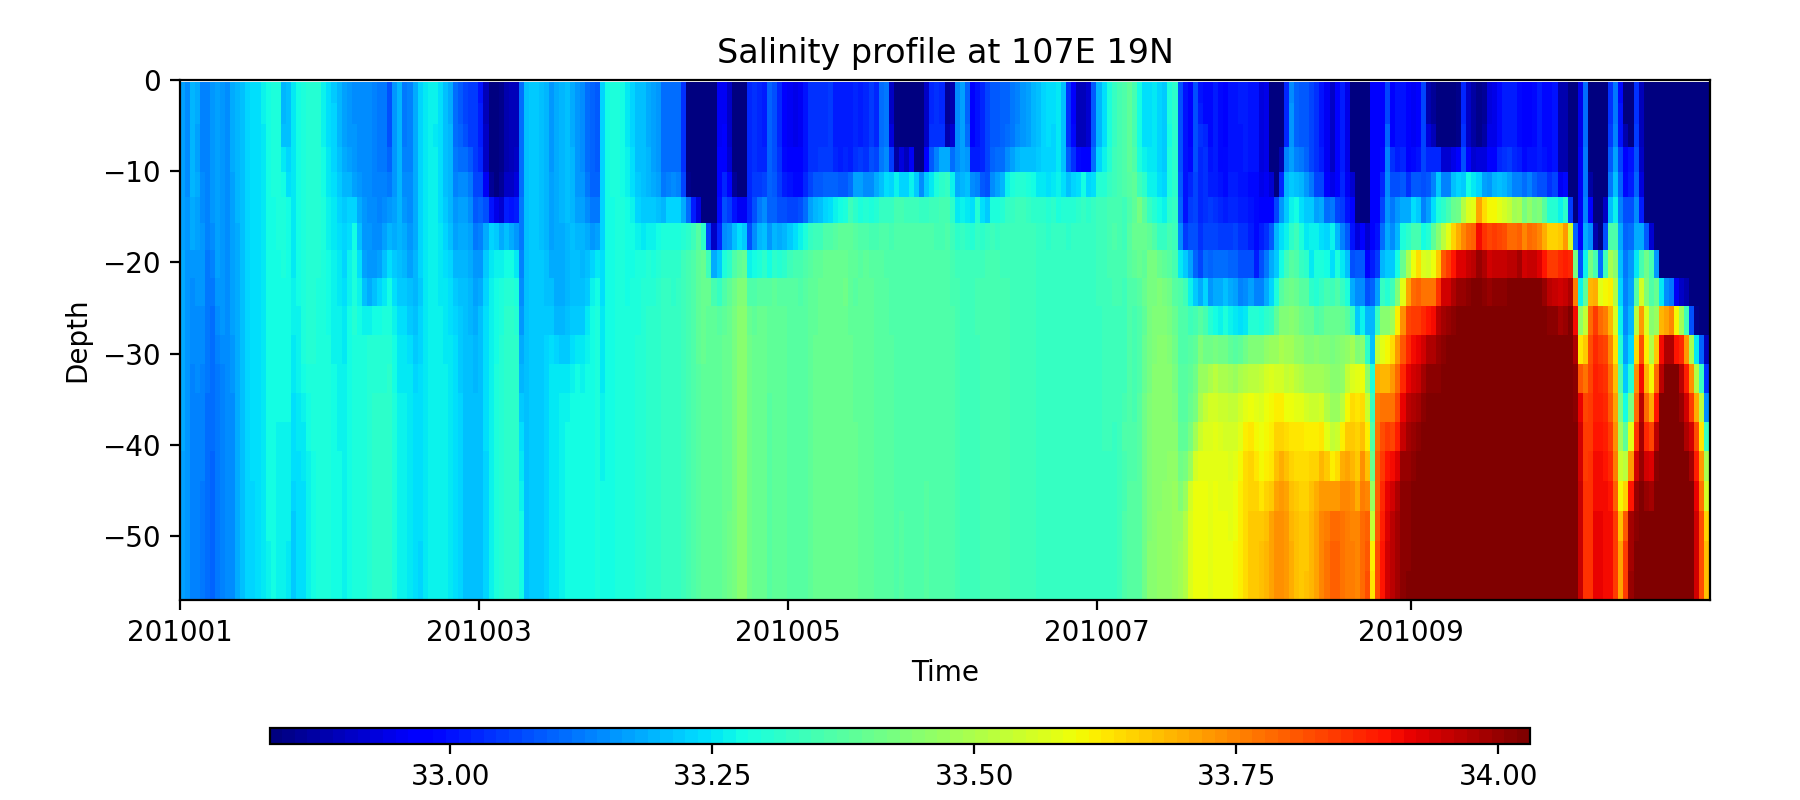
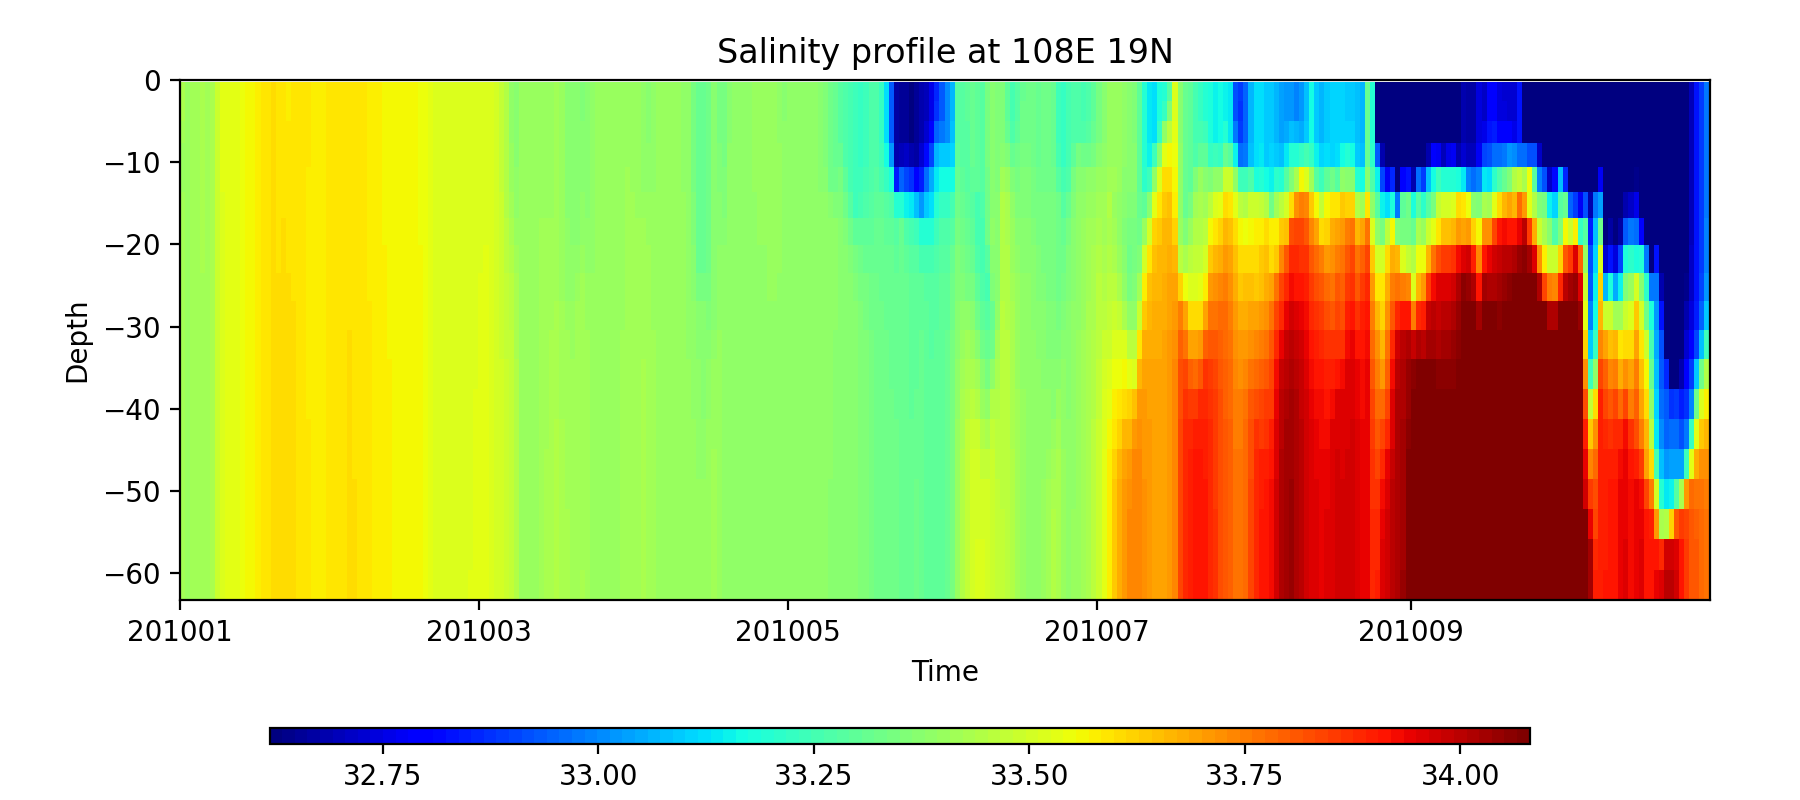
# Step 4: Plot heatmaps for each point
for i in range(len(lon_p)):
print(data_draw[i, :, :].shape, depth_t[:, point_index[i, 0], point_index[i, 1]].shape)
gc.plot_heatmap(
title="Salinity profile at %sE %sN" % (lon_p[i], lat_p[i]),
tstart=tstart,
tend=tend,
data_draw=data_draw[i, :, :],
depth=depth_t[:, point_index[i, 0], point_index[i, 1]],
path_save="/prod/projects/data/tungnd/figure/",
name_save="example3.2",
)