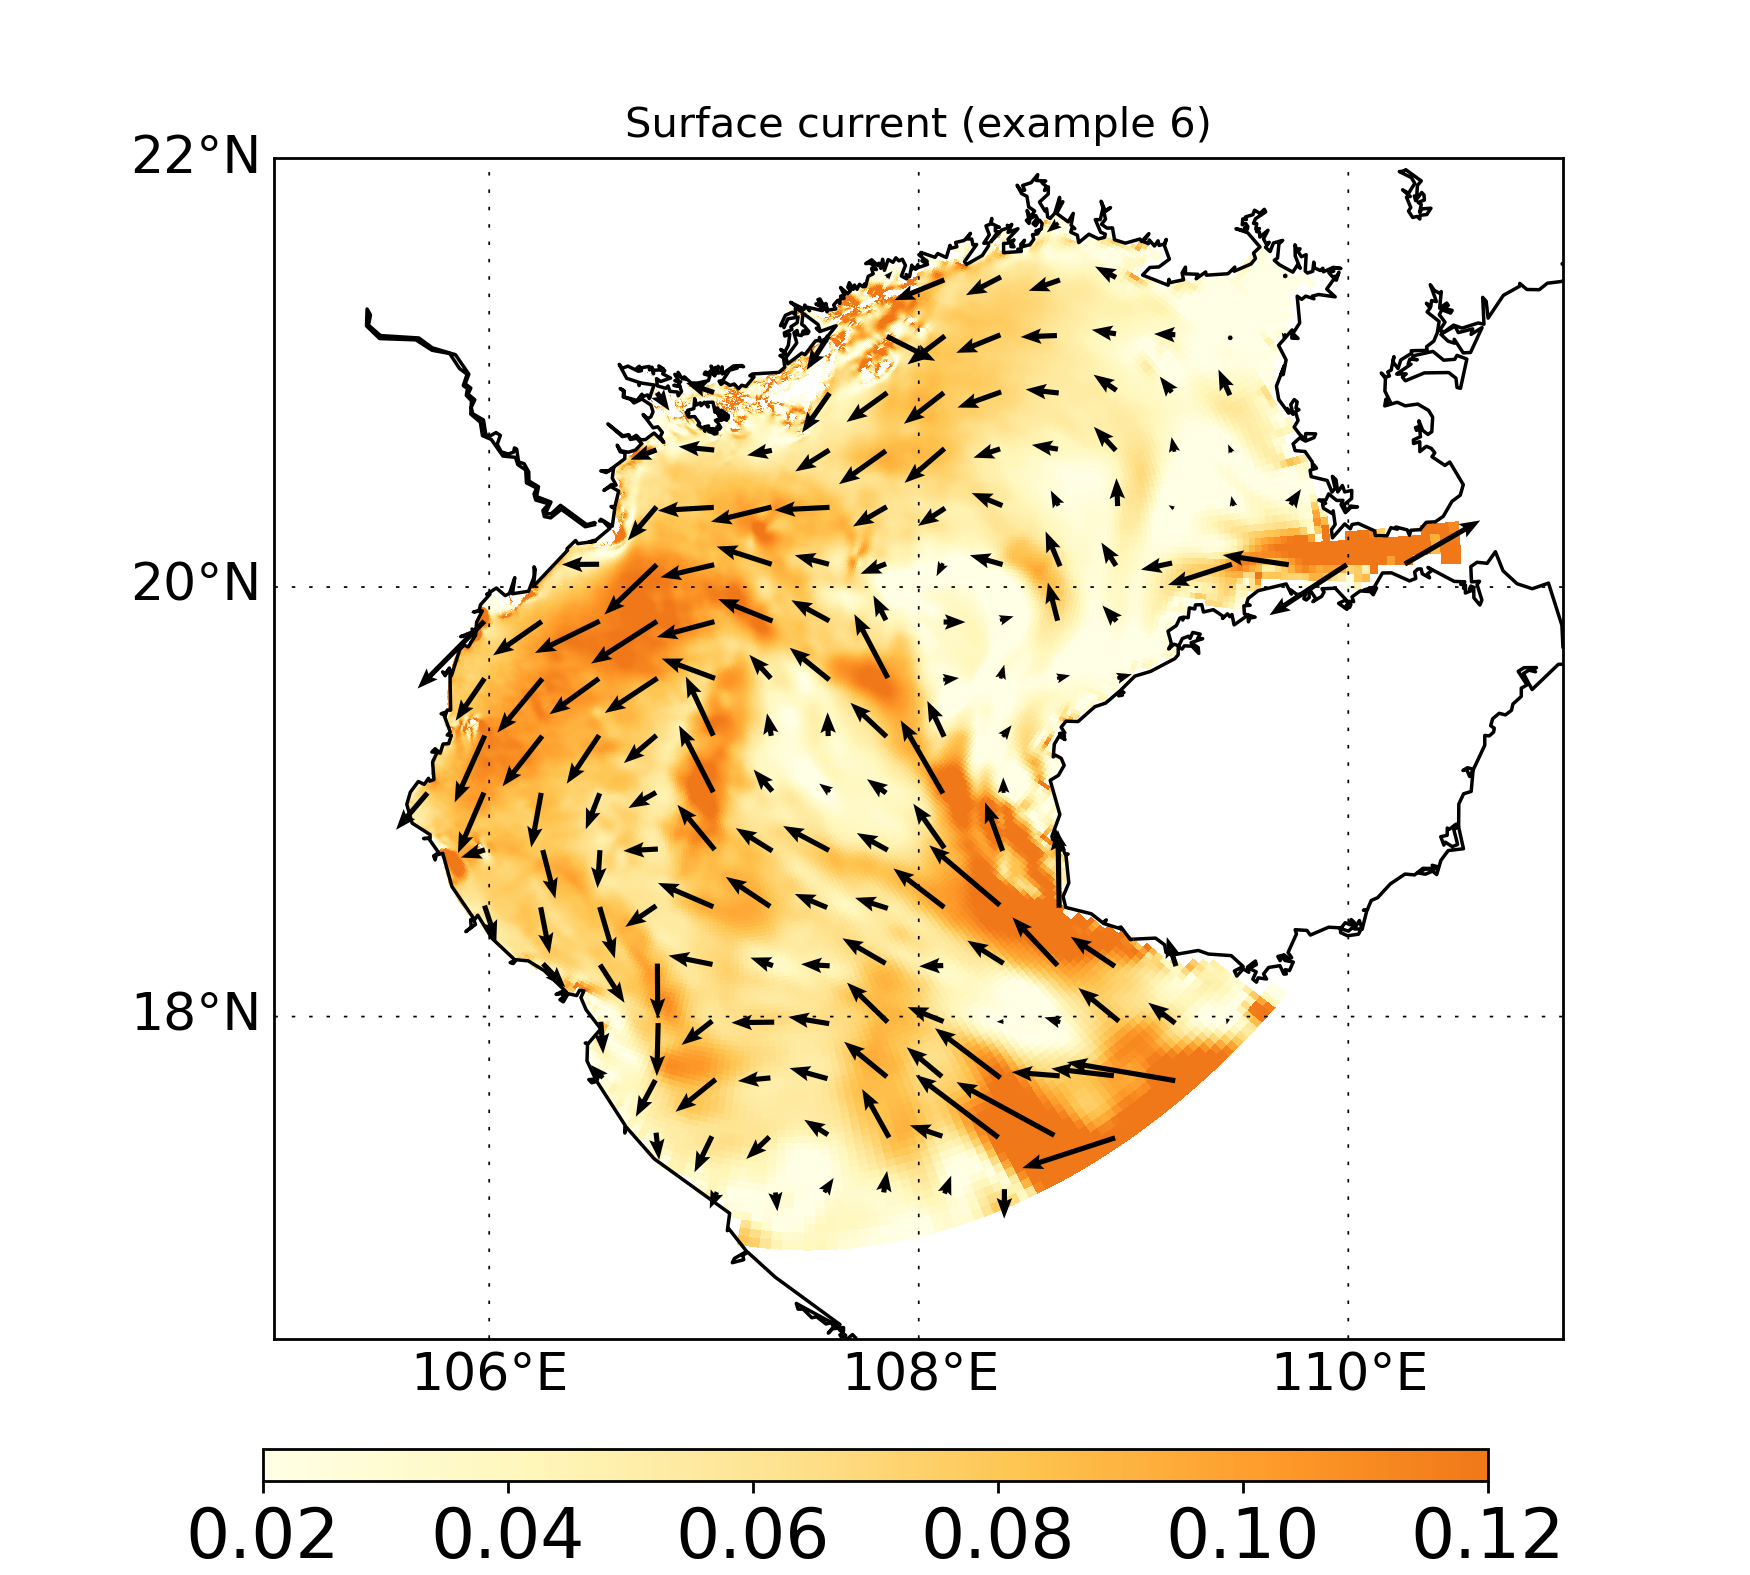
Example 6: Plot vector map (e.g. wind, current)#
This example demonstrates how to import file and draw a section plot a wind map with GINCCO_lib
using GINCCO_lib.map_plot.map_draw_uv().
Code Example#
Now we will import the library and the grid
# =========================
# IMPORTS
# =========================
import numpy as np
import GINCCO_lib as gc
from netCDF4 import Dataset
from datetime import *

# =========================
# CONFIGURATION
# =========================
tstart = datetime(2010, 1, 1)
tend   = datetime(2010, 1, 10)

path = '/work/users/tungnd/GOT271/GOT_REF5/OFFLINE/'

# =========================
# LOAD GRID
# =========================
fgrid = Dataset(path + 'grid.nc', 'r')
lat_t = fgrid.variables['latitude_t'][:]
lon_t = fgrid.variables['longitude_t'][:]
mask_t_var = fgrid.variables['mask_t']
if mask_t_var.ndim == 3:
    mask_t = mask_t_var[0, :, :]
elif mask_t_var.ndim == 2:
    mask_t = mask_t_var[:, :]
sin_t  = fgrid.variables['gridrotsin_t'][:,:]
cos_t  = fgrid.variables['gridrotcos_t'][:,:]
Now import, interpolate and rotate data
# Step 1: Import data
u_surface = gc.import_surface(path, 'u', tstart, tend, ignore_missing='False')
v_surface = gc.import_surface(path, 'v', tstart, tend, ignore_missing='False')


#Step 2: convert to t
u_t, uncer_u = gc.interpolate_to_t(u_surface, stagger = 'u', mask_t = mask_t)
v_t, uncer_v = gc.interpolate_to_t(v_surface, stagger = 'v', mask_t = mask_t)

#Step 3: Choose a day and rotate it
U1 =  u_t[1,:,:] * cos_t + v_t[1,:,:] * sin_t
V1 = -u_t[1,:,:] * sin_t + v_t[1,:,:] * cos_t
Plot it
#Step 4: Draw
gc.map_draw_uv(
    lon_min=105, lon_max=111,
    lat_min=16.5, lat_max=22,
    title="Surface current (example 6)",
    lon_data=lon_t,
    lat_data=lat_t,
    data_u= U1, data_v= V1,
    mask_ocean = mask_t,
    path_save="/prod/projects/data/tungnd/figure/",
    name_save="wind_map_example6",
    quiver_max_n=20,   # ~max arrows per axis (auto step so arrows <= quiver_max_n x quiver_max_n)
    quiver_scale=2  # higher is shorter arrow. lower is longer arrow